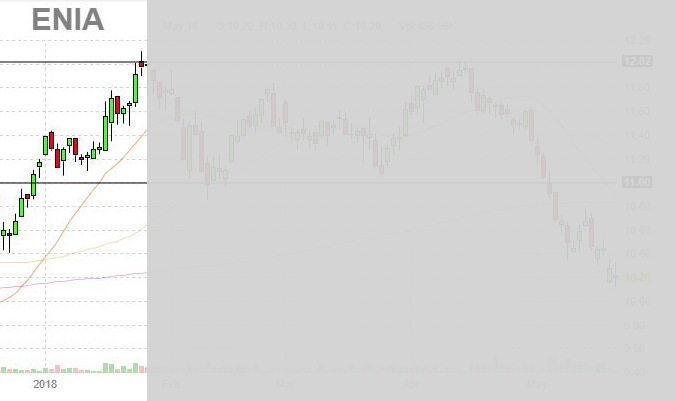
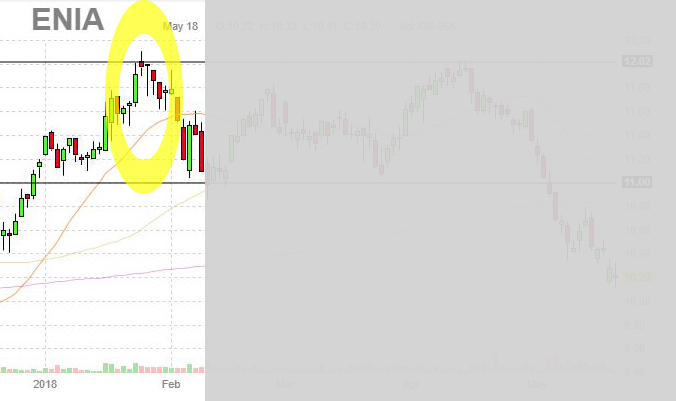
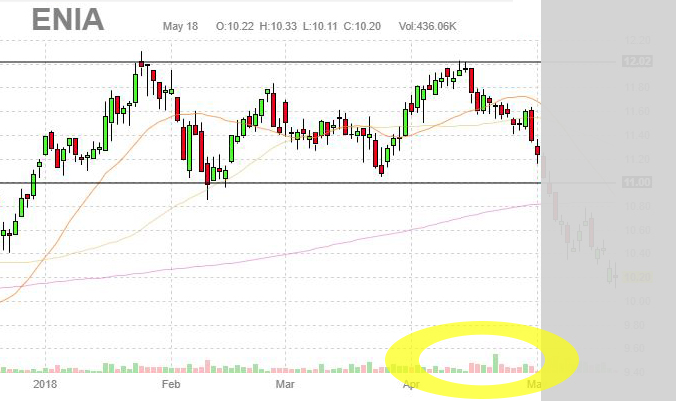
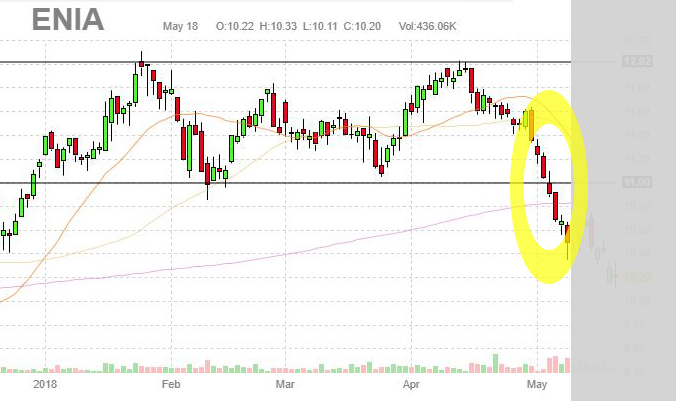
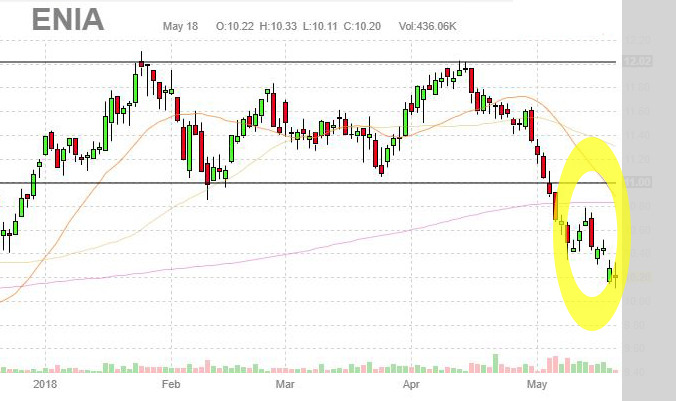
When trends change from bullish to bearish (or vice versa) there are indicators that the seasoned trader is looking for. The Double Top Reversal marks a medium or long-term change in trend. The reversal is from bullish to bearish. Keeping an eye out for fakeouts, there are six different points that happen for the pattern to be confirmed. Let’s take a look at each of those in more detail using a May 2018 chart of ENIA.
The Setup
As with any reversal, a trend must already be in place. The longer the trend, the more substantial the double top reversal could be. In this case, the stock should be trading in an uptrend (bullish trend).
Pattern Details
Here’s how the double-top pattern is created and the specific points you want to look out for during formation and to confirm that the pattern is complete. Look for the 1st Top, a Decline that turns around and leads to a 2nd Top, followed by a decline, support breakdown that turns to resistance and increased volume. Let’s look at each of those in more detail.
1st Top
Stocks commonly hit a new high and retreat. That in itself is nothing to write home about. In the case of the reversal pattern, a new high should be hit and a retreat happen. Since this happens in stocks all time, it doesn’t mean anything by itself.
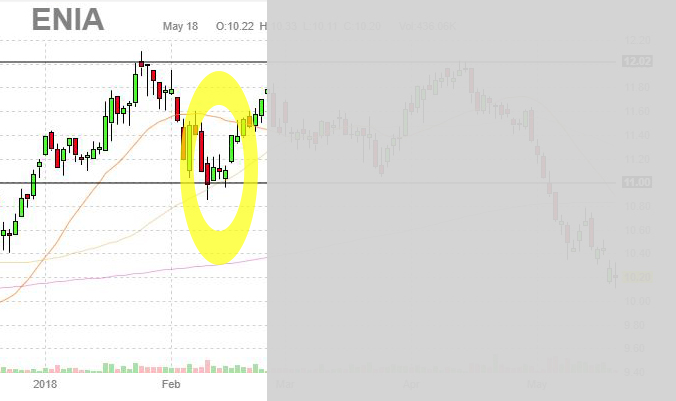
Decline
If the retreat from the high is 10% or more and then turns back to the positive, you may be on your way to witnessing the formation of a double top pattern. Not every low that happens is a one-bar occurrence so don’t be fooled by a multiple session low that eventually turns positive and starts to climb back up to the previous high.
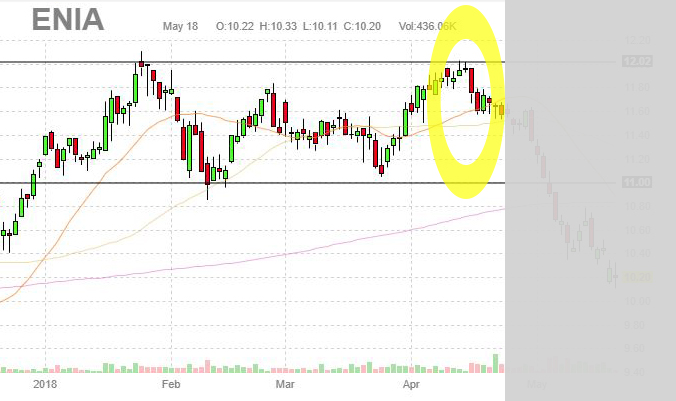
2nd Top
Once the stock climbs to the previous high, it is expected to meet with resistance. Since this is common, it doesn’t mean that you have a double-top forming – it only means you are one step closer. Typically, the second top isn’t exactly the same high as before. A variation of around 3% is close enough.
Decline from Top
As the stock starts to drop from the second top, you should notice an increase in volume. This increase will tell you that the bears are gaining strength and will be testing the previous support soon.
Support Breakdown
Once the stock falls to the previous support level, the pattern still isn’t complete. You still need to have an increase in volume and a faster drop than normal. Once the stock breaks through support and heads lower, the pattern is complete.
Support Turned Resistance
As happens in stock trading, support that is broken becomes resistance for the future. During the formation of the pattern, a stock will sometimes rise to test the new resistance – which will give a trader a chance to either get out of a position or to start a new short position in the stock.
Now What?
If you decide to exit your trade because the double-top is complete then you are done. If, however, you decide to take a new short position because of the break of previous support, then you should do some quick math to find your possible future exit price. Typically, the distance from the break of support up to the top of the pattern will tell you how low you could expect the stock to fall. As in all stock trading this is only an approximation and other factors should be included in calculating your exit price in your trading plan.
Final Thoughts
To wrap this all up, it’s important to make sure that the stock you think is forming a double top meets the six criteria. It should be in a long uptrend, hit a first top then decline, hit a second top then decline and break the previous support area with increased volume. If all of that happens, you could expect that the trend has been reversed and will continue down in the future.
Additional Viewing Options:
Would you like to view a video or presentation on this topic?
Check out this video on Youtube
Download the presentation on SlideShare
