Understanding continuation patterns can help you complete a successful trade since many technical traders use them to understand the psychology of buyers and sellers. Let’s take a look at defining a continuation pattern, learning how to use them in trading and also going over the most popular ones.
What is a Continuation Pattern?
The definition of a continuation pattern is a trend that shows a temporary change in behavior that will eventually go back to continue the existing trend. In other words, an uptrend that temporarily changes direction to go sideways for awhile that then goes back to an uptrend. The same thing would be true of a downtrend. Typically these temporary changes are times of consolidation in which a stock moves mostly sideways instead of up or down.
How do I use them in trading?
As with any trading pattern you want to be able to identify them and understand what they mean so you will have a better idea of what could happen with the individual stock. Whether you are a strong technical trader or not, it’s important to know the process by which other traders function. When you know that different patterns mean that a stock will likely continue up or down, you will know what others traders are looking for to base their buying / selling decisions.
Which ones should I know?
There are 3 basic types of continuation patterns that every technical trader should know. As is typical in trading, each of the types has different variations that you should learn. For example, there is a Flag pattern and also a Pennant pattern. While they are both similar, they have different meanings and points to consider before using them in your analysis.
Typically, while each variation is similar, they often have contrasting meanings. Normally, one is found in an uptrend and the other in a downtrend. This leads the technical analyst to derive different entry and exit points depending on whether they are buying or selling.
Now, let’s take a look at the different patterns and review each in more detail.
Flag / Pennant
Explanation of Pattern
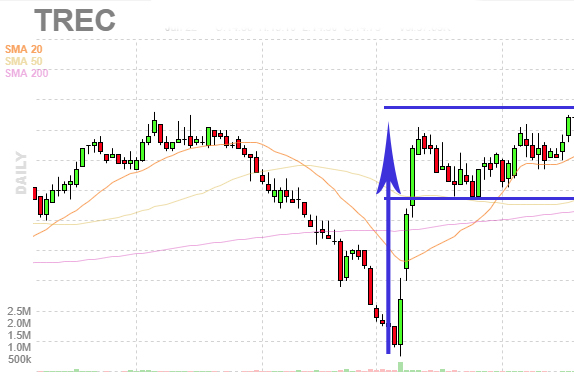
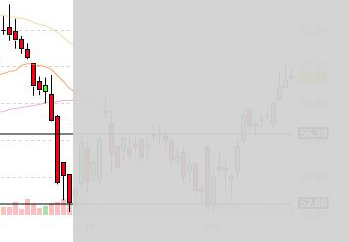
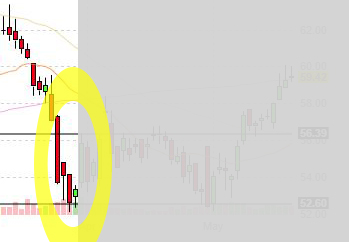
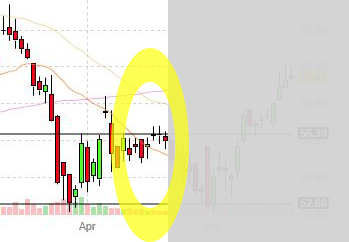
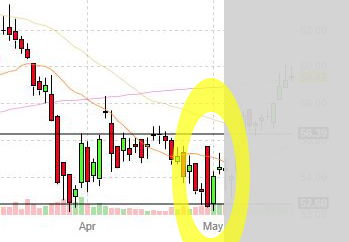
A flag chart pattern is formed when a stock consolidates in a narrow range after a sharp move. The pattern looks like a flag because the consolidation (a small rectangle) is connected to the large and fast move (pole).
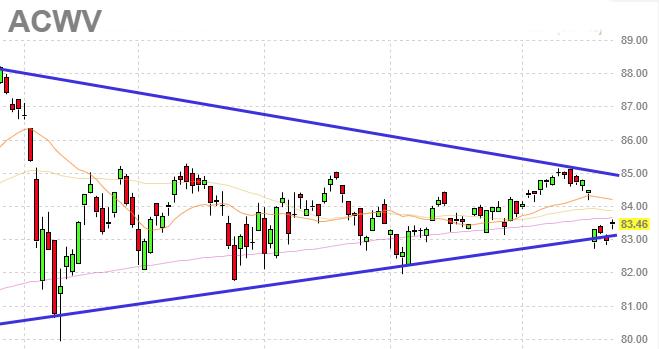
While a Pennant is a bit different because it is formed when a stock consolidates in a converging range after a sharp move. The pattern looks like a pennant because the consolidation (symmetrical triangle) is connected to the large and fast move (pole).
Points to Consider
The flag portion of the pattern must run between parallel lines. It can either be slanted up, down or sideways.
Flags that angle in the same direction as the previous move (example: pole up and flag slants up), minimizes the outcome of the pattern. Therefore, you really want to see a sharp move up followed by a sideways / slightly angled down range. Or, a sharp move down followed by a sideways / slightly angled up range.
The pennant portion of the pattern must run between converging lines. It should be sideways or neutral. The price action should just be contained between the converging trend lines.
For both the flag and pennant pattern, the move before the flag/pennant part (the pole) must be a sharp move, nearly straight up, and be noticeably bigger and faster than the recent price moves. This fast and quick price movement shows strong buying/selling action…which we hope to profit from.
Example
Symmetrical Triangle
Explanation of Pattern
A triangle pattern, regardless of whether it’s balanced / ascending / descending is a set of converging lines formed from the support and resistance lines on a stock. The way the lines are going to meet determines what type of triangle pattern is created. For the pattern to be considered symmetrical, it would show that the support line and the resistance line converge in the middle of the high/low.
Points to Consider
The price target for a breakout or breakdown from a symmetrical triangle is equal to the distance from the high and low of the earliest part of the pattern applied to the breakout price point.
The stop loss for the symmetrical triangle pattern is often just below the breakout point.
Example
Ascending / Descending Triangle
Explanation of Pattern
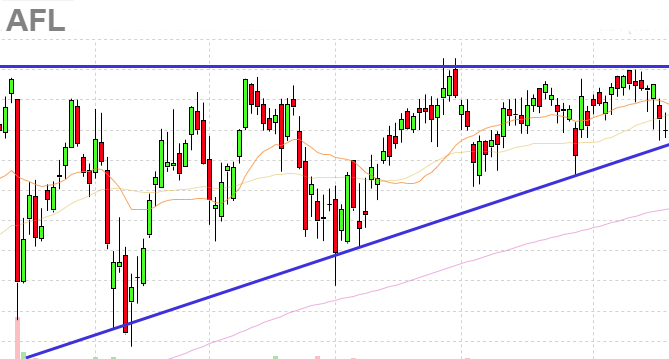
Two variations of the symmetrical triangle pattern are the ascending and descending triangle patterns. Ascending triangles have a horizontal upper trend line, with a rising lower trend line, which predicts a potential breakout higher. Descending triangles are the opposite with a horizontal lower trend line, and a falling upper trend line, predicting a potential breakdown lower.
Points to Consider
Focus more on breakouts to the upside during uptrends and breakouts to the downside during downtrends.
Example
Channel (Up / Down)
Explanation of Pattern
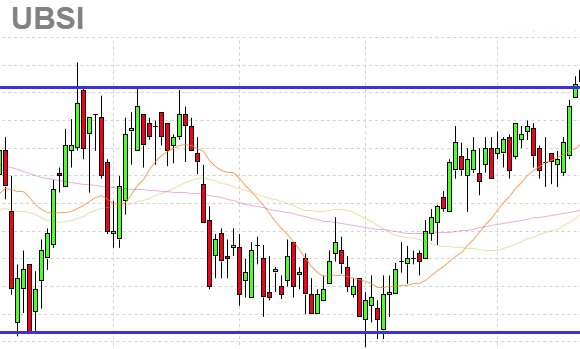
A channel pattern is created when the support line and resistance line are parallel to each other. This typically happens during a consolidation phase where the stock becomes range bound with the general high and low of the days (or at least the opening and closing of the days) remaining consistent for a period of time.
Points to Consider
If the Channel rises – which is to say that it is setting higher highs and higher lows, then it’s considered an Up Channel. However, if the opposite is true – a stock is setting lower highs and lower lows, then it’s forming a Down Channel. Each of these give different buy and sell signals and are important to consider when you are wanting to go long or short on a stock.
Example
Review
Now that you’ve learned about Flags / Pennants, Triangles and Channels you should be more confident in your trading. Knowing that Flags and Pennants are formed after a strong move will help you identify the possible formation. Seeing an ascending triangle on a chart can help you predict where a stock might breakout or breakdown. Finally, when you notice a channel forming, you can tell that a stock is going to be stuck consolidating for a length of time.
By understanding the differences in the patterns, as well as the psychology behind each one, you should be positioned to benefit when one of these patterns shows themselves on the charts of your favorite stocks.
Additional Viewing Options:
Would you like to view a video or presentation on this topic?
Check out this video on Youtube
Download the presentation on SlideShare
